- 0 Comments
- 1225 views
Welcome to CodeNameJessica
✨ Welcome to CodeNameJessica! ✨
💻 Where tech meets community.
Hello, Guest! 👋
You're just a few clicks away from joining an exclusive space for tech enthusiasts, problem-solvers, and lifelong learners like you.
🔐 Why Join?
By becoming a member of CodeNameJessica, you’ll get access to:
✅ In-depth discussions on Linux, Security, Server Administration, Programming, and more
✅ Exclusive resources, tools, and scripts for IT professionals
✅ A supportive community of like-minded individuals to share ideas, solve problems, and learn together
✅ Project showcases, guides, and tutorials from our members
✅ Personalized profiles and direct messaging to collaborate with other techies
🌐 Sign Up Now and Unlock Full Access!
As a guest, you're seeing just a glimpse of what we offer. Don't miss out on the complete experience! Create a free account today and start exploring everything CodeNameJessica has to offer.
CodeName Blogs
Featured Entries


- 0 Comments
- 1201 views

- 0 Comments
- 1828 views

- 0 Comments
- 1120 views

- 0 Comments
- 397 views
Our community blogs
-
Latest entry by Blogger,
by: Abhishek Prakash
Mon, 30 Jun 2025 07:16:37 GMT
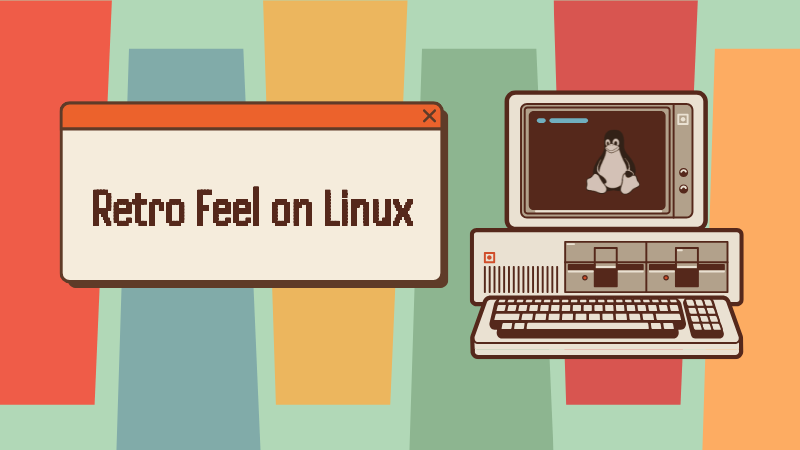
Retro techs are no longer stranger things. Just like vinyl records and vintage fashion, retro computing has captured our collective imagination, irrespective of the age group.
I mean, there's something deeply satisfying about amber-on-black terminals and chunky pixel fonts that modern UIs can't replicate.
The good thing here is that us Linux users are perfectly positioned to embrace this nostalgia wave.
No, I am not talking about those ultra-lightweight distros that involuntarily give retro vibes of late 90s and early 2000s. I am going to share a few interesting software that will help you get the retro feel on your modern Linux system.
1. Cool Retro Term
I'll start with my favorite, that is also a functional tool.
cool-retro-term is a terminal emulator which mimics the look and feel of the old cathode tube screens. That's just about it. You do not get any special abilities, just the good-old look.
But here's the thing. You can use it like your regular terminal, it have vintage looks but the modern features still work the same.
There are more than one presets of colors and style available.
Cool Retro Term
Installing Cool Retro Term
You can install it on Ubuntu, Fedora, and Arch Linux using the commands respectively:
sudo apt install cool-retro-term #For Debian/Ubuntu sudo dnf install cool-retro-term #For Fedora sudo pacman -Syu cool-retro-term #For Arch based distros2. RSC8
RSC8 is a CHIP-8 virtual machine/emulator written in Rust with no_std core. It is yet another makeover for your terminal. So, if you like to use a retro terminal but built with Rust, give this a try.
RSC8 Chip-8 Virtual machine/emulator
Install it using cargo.
cargo install --locked --git https://github.com/jerryshell/rsc8To use rsc8, you'll have to download ROMs of your choice from this GitHub repo and then use the following command:
rsc8_tui <your_rom.ch8>3. Retro Pie
RetroPie transforms your Raspberry Pi, ODroid C1/C2, or PC into a nostalgic gaming powerhouse.
It leverages platforms like Raspbian, EmulationStation, RetroArch, and other innovative projects, allowing you to enjoy classic Arcade, home-console, and vintage PC games with minimal hassle.
RetroPie Walkthrough
Since there were multiple kinds of platforms/consoles in the past, there are different emulators for them.
But that's only half of the story. You also need to download ROMs that consist of games of that platform.
For example, if you want to play games that were available Nintendo's NES console, you download the ROM with NES games and then use the NES emulator in RetroPi to load this ROM. It's like inserting a virtual disk.
The problem here is that these ROMs are often deemed illegal to distribute, and hence the websites that host them are often removed.
Playing Super Mario World in RetroPie
Installing RetroPi
Please ensure that you have git installed on your system as you'll have to clone the Git repo here.
cd
git clone --depth=1 https://github.com/RetroPie/RetroPie-Setup.git
Run the setup script:
cd RetroPie-Setup
sudo ./retropie_setup.sh
Follow the onscreen instructions for a basic installation.
4. Hot Dog Linux
Hot Dog Linux is an X11 Window Manager with Windows 3.1 Hot Dog Stand, Amiga Workbench, Atari ST GEM, Mac Classic and Aqua UI pre-installed.
HOTDOG is an acronym that stands for Horrible Obsolete Typeface and Dreadful Onscreen Graphics.
HOTDOG Linux
It is built using Objective-C and uses bitmapped graphics, low DPI displays. There are no unicode support here.
Installing Hot Dog Linux:
Download the ISO and install in VirtualBox. Make sure 3D acceleration is enabled.
🚧It only worked in GNOME Boxes for me.5. DOSBox or DOSBox Staging
DOSBox is free and open-source software that allows you to emulate the MS-DOS operating systems from the previous century.
It allows you to play the 8-bit games.
Playing Doom2 in DOSBox
DOSBox also emulates CPU:286/386 realmode/protected mode, Directory FileSystem/XMS/EMS, Tandy/Hercules/CGA/EGA/VGA/VESA graphics, a SoundBlaster/Gravis Ultra Sound card for excellent sound compatibility with older games.
Installing DOSBox
On Ubuntu, and Arch, you can use the following commands respectively:
sudo apt install dosbox #For Ubuntu/Debina
sudo pacman -Syu dosbox #For Arch
DOSBox Staging
Fedora ships with DOSBox Staging, a modern continuation of DOSBox. DOSBox Staging is also available in Flathub.
For Arch, it is in AUR. And, for Ubuntu and Mint, add the following PPA to get it installed:
sudo add-apt-repository ppa:feignint/dosbox-staging sudo apt-get update sudo apt install dosbox-stagingWrapping Up
Linux enables users to have a godly amount of customization options. Whether you want your desktop to look clean, and contemporary, or you want to give it a retro look, there are certainly a few tools for that.
Come to think of, I should do a tutorial on how to give a retro makeover to your Linux distro, somewhat like the modern makeover video of Linux Mint.
Linux makes it easy to bring the retro vibe back to life. Whether it’s an old-school terminal, a full-blown vintage desktop, or classic games from the 90s, there’s a tool for every kind of nostalgia.
What is your favorite tool that we missed listing here? Let me know in the comments below.
Recent Entries
-
Latest entry by Blogger,
By: Edwin
Wed, 30 Apr 2025 13:08:34 +0000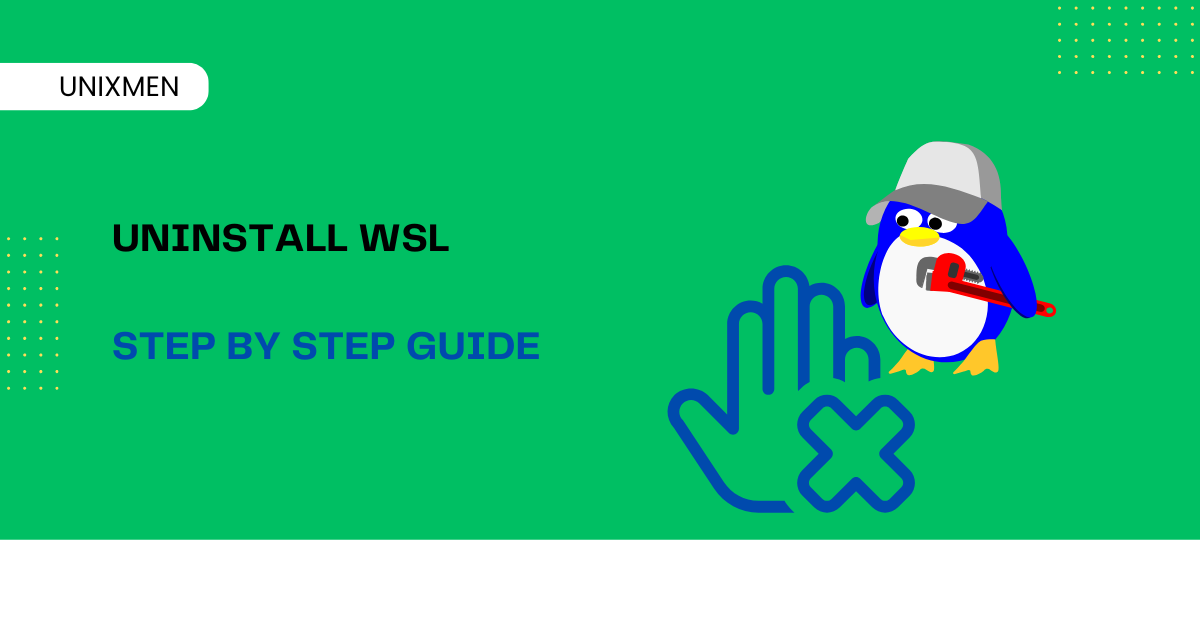
A lot of people want Linux but do not want to go either remove Windows or take up the overwhelming task of dual booting. For those people, WSL (Windows Subsystem for Linux) came as a blessing. WSL lets you run Linux on your Windows device without the overhead of a Virtual Machine (VM). But in some cases where you want to fix a problem or simply do not want WSL anymore, you may have to uninstall WSL from your Windows system.
Here is step-by-step guide to remove WSL from your Windows system, remove any Linux distribution, delete all related files, and clear up some disk space. Ready? Get. Set. Learn!
What is WSL
You probably knew by now that we will always start with the basics i.e., what WSL does. Think of WSL as a compatibility layer for running Linux binaries on Microsoft Windows systems. It comes in two versions:
- WSL 1: Uses a translation layer between Linux and Windows.
- WSL 2: Uses a real Linux kernel in a lightweight VM.
All around the world, WSL is a favourite among developers, system administrators, and students for running Linux tools like bash, ssh, grep, awk, and even Docker. But if you have moved to a proper Linux system or just want to do a clean reinstall, here are the instructions to remove WSL completely without any errors.
Step 1: How to Uninstall Linux Distributions
The first step to uninstall WSL completely is to remove all installed Linux distributions.
Check Installed Distros
To check for the installed Linux distributions, open PowerShell or Command Prompt and run the command:
wsl --list --all
After executing this command, you will see a list of installed distros, such as:
- Ubuntu
- Debian
- Kali
- Alpine
How to Uninstall a Linux Distro
To uninstall a distro like Ubuntu, follow these instructions:
- Press Windows key + I to open Settings window.
- Go to Apps, then click Installed Apps (or Apps & Features).
- Search for your distro and click Uninstall.
Repeat for all distros you no longer need. If you plan to uninstall WSL completely, we recommend removing all distros.
if you prefer PowerShell, run these commands
wsl --unregister <DistroName>
For example, if you want to remove Ubuntu, execute the command:
wsl --unregister Ubuntu
This removes the Linux distro and all its associated files.
Step 2: Uninstall WSL Components
Once we have removed the unwanted distros, let us uninstall the WSL platform itself.
- Open Control Panel and navigate to Programs and then click Turn Windows features on or off.
- Uncheck these boxes:
- Windows Subsystem for Linux
- Virtual Machine Platform (used by WSL 2)
- Windows Hypervisor Platform (optional)
- Click OK and restart your system.
Step 3: Remove WSL Files and Cache
Even after uninstalling WSL and Linux distributions, some data might remain. Here are the instructions to delete WSL’s cached files and reclaim disk space.
To delete the WSL Folder, open File Explorer and go to:
%USERPROFILE%\AppData\Local\Packages
Look for folders like:
- CanonicalGroupLimited…Ubuntu
- Debian…
- KaliLinux…
Delete any folders related to WSL distros you removed.
Step 4: Remove WSL CLI Tool (Optional)
If you installed WSL using the Microsoft Store (i.e., “wsl.exe” package), you can also uninstall it directly from the Installed Apps section:
- Go to Settings, and then to Apps and then open Installed Apps.
- Search for Windows Subsystem for Linux.
- Click Uninstall.
Step 5: Clean Up with Disk Cleanup Tool
Finally, use the built-in Disk Cleanup utility to clear any temporary files.
- Press “Windows key + S and search for Disk Cleanup.
- Choose your system drive (usually drive C:).
- Select options like:
- Temporary files
- System created Windows error reporting
- Delivery optimization files
- Click OK to clean up.
Bonus Section: How to Reinstall WSL (Optional)
If you are removing WSL due to issues or conflicts, you can always do a fresh reinstall.
Here is how you can install latest version of WSL via PowerShell
wsl --install
This installs WSL 2 by default, along with Ubuntu.
Wrapping Up
Uninstalling WSL may sound tricky, but by following these steps, you can completely remove Linux distributions, WSL components, and unwanted files from your system. Whether you are making space for something new or just doing some digital spring cleaning, this guide ensures that WSL is uninstalled safely and cleanly.
If you ever want to come back to the Linux world, WSL can be reinstalled with a single command, which we have covered as a precaution. Let us know if you face any errors. Happy learning!
The post Uninstall WSL: Step-by-Step Simple Guide appeared first on Unixmen.
Recent Entries
-
Latest entry by Blogger,
by: Chris Coyier
Mon, 30 Jun 2025 17:04:57 +0000Mr. Brad Frost, and his brother Ian, have a new course they are selling called Subatomic: The Complete Guide to Design Tokens.
To be honest, I was a smidge skeptical. I know what a design token is. It’s a variable of a color or
font-familyor something. I pretty much only work on websites, so that exposes itself as a--custom-propertyand I already know that using those to abstract common usage of colors and fonts is smart and helpful. Done. I get that people managing a whole fleet of sites (and apps running in who-knows-what technologies) need a fancier token system, but that ain’t me.But then we had those fellas on ShopTalk Show and I’ve updated my thinking that you really do want to lean on the expertise of people that have done this time and time again at scale.
(p.s. they also gave us a 20% discount code when they were on the show: SHOPTALKSHOWISAWESOME)
Spoiler: they advocate for a three-tier system of custom properties. The first is just the raw ingredients. Colors, but you’re just naming the color; sizes, but you’re just naming the sizes. Then there is this middle tier where you are essentially crafting a theme from those raw ingredients. And this layer is the most important, as it gives you this perfect layer of abstraction where you’re both not reaching into the raw ingredients and you’re not being too overly specific, like naming individual parts of components. The third layer should be avoided as best as it can, but if you absolutely need to get hyper specific, this is where you do it, and are still keeping in the land of custom properties.
This feels particularly smart to me, and I wish I had the benefit of the Frost Brother’s expertise on this before building some custom property systems I have built in the past. I tend to have that first layer with just the raw ingredients, and then jump right to what they’d call the third tier, which leads to a real blowing up of how many custom properties are in use, to the point that it feels overly cumbersome and like the whole system isn’t even helping that much. I’ll definitely be thinking about the theming tier next time I have a good refactoring opportunity.
Brad has also been steady on his global design system idea. I’ve posted my thoughts on this before, but I keep coming back to this one:
It feels like every decision you make will chip away at who will use it.
I’m fascinated at seeing how decisions get made that keep this thing as “global” as possible. That absolutely must be done, otherwise it’s just another design system which I thinks falls short of the goal. I appreciated Brian’s deep thoughts on it all as well, and I’m basically writing all this as an excuse to link to that.
Would a global design system have any design to it at all? Maybe; maybe not. It makes me wonder if the era of “flat design” that it seems like we’ve been in for a decade or so was partially the result of design systems, where the simpler things look the more practical it is to build all the “lego blocks” of a cohesive aesthetic. But it’s likely design trends move on. Maybe flat is over. Are design systems ready for very fancy/complex looks? Definitely worth a read is Amelia’s thoughts on “balancing the hard structure and soft flexibility” of UIs.
Speaking of design tokens, designtokens.fyi is a nice site for defining all the terms that design systems/tokens people like to throw around. A site with word definitions can be awfully boring so I appreciate the fun design here. I like the idea of calling a value system a “t-shirt” where you’re actually defining, say, a set of padding options, but the options follow the mental model of t-shirt sizes.
Sometimes you just need to look and see what other people are doing. In design, there always has been and will be design galleries full of inspirational stuff. But instead of linking to one of those, I’m going to link to to the “Home of the internet’s finest website headlines.” I love a good headline, myself. I’ve seen far too many sites that do a terrible job of just saying what their point is.
Recent Entries
-
SaltStack (SALT): A Comprehensive Overview
SaltStack, commonly referred to as SALT, is a powerful open-source infrastructure management platform designed for scalability. Leveraging event-driven workflows, SALT provides an adaptable solution for automating configuration management, remote execution, and orchestration across diverse infrastructures.
This document offers an in-depth guide to SALT for both technical teams and business stakeholders, demystifying its features and applications.
What is SALT?
SALT is a versatile tool that serves multiple purposes in infrastructure management:
Configuration Management Tool (like Ansible, Puppet, Chef): Automates the setup and maintenance of servers and applications.
Remote Execution Engine (similar to Fabric or SSH): Executes commands on systems remotely, whether targeting a single node or thousands.
State Enforcement System: Ensures systems maintain desired configurations over time.
Event-Driven Automation Platform: Detects system changes and triggers actions in real-time.
Key Technologies:
YAML: Used for defining states and configurations in a human-readable format.
Jinja: Enables dynamic templating for YAML files.
Python: Provides extensibility through custom modules and scripts.
Supported Architectures
SALT accommodates various architectures to suit organizational needs:
Master/Minion: A centralized control model where a Salt Master manages Salt Minions to send commands and execute tasks.
Masterless: A decentralized approach using
salt-sshto execute tasks locally without requiring a master node.
Core Components of SALT
Component
Description
Salt Master
Central control node that manages minions, sends commands, and orchestrates infrastructure tasks.
Salt Minion
Agent installed on managed nodes that executes commands from the master.
Salt States
Declarative YAML configuration files that define desired system states (e.g., package installations).
Grains
Static metadata about a system (e.g., OS version, IP address), useful for targeting specific nodes.
Pillars
Secure, per-minion data storage for secrets and configuration details.
Runners
Python modules executed on the master to perform complex orchestration tasks.
Reactors
Event listeners that trigger actions in response to system events.
Beacons
Minion-side watchers that emit events based on system changes (e.g., file changes or CPU spikes).
Key Features of SALT
Feature
Description
Agent or Agentless
SALT can operate in agent (minion-based) or agentless (masterless) mode.
Scalability
Capable of managing tens of thousands of nodes efficiently.
Event-Driven
Reacts to real-time system changes via beacons and reactors, enabling automation at scale.
Python Extensibility
Developers can extend modules or create custom ones using Python.
Secure
Employs ZeroMQ for communication and AES encryption for data security.
Role-Based Config
Dynamically applies configurations based on server roles using grains metadata.
Granular Targeting
Targets systems using name, grains, regex, or compound filters for precise management.
Common Use Cases
SALT is widely used across industries for tasks like:
Provisioning new systems and applying base configurations.
Enforcing security policies and managing firewall rules.
Installing and enabling software packages (e.g., HTTPD, Nginx).
Scheduling and automating patching across multiple environments.
Monitoring logs and system states with automatic remediation for issues.
Managing VM and container lifecycles (e.g., Docker, LXC).
Real-World Examples
Remote Command Execution:
salt '*' test.ping(Pings all connected systems).salt 'web*' cmd.run 'systemctl restart nginx'(Restarts Nginx service on all web servers).
State File Example (YAML):
nginx:
  pkg.installed: []
  service.running:
    - enable: True
    - require:
      - pkg: nginx
Comparing SALT to Other Tools
Feature
Salt
Ansible
Puppet
Chef
Language
YAML + Python
YAML + Jinja
Puppet DSL
Ruby DSL
Agent Required
Optional
No
Yes
Yes
Push/Pull
Both
Push
Pull
Pull
Speed
Very Fast
Medium
Medium
Medium
Scalability
High
Medium-High
Medium
Medium
Event-Driven
Yes
No
No
Limited
Security Considerations
SALT ensures secure communication and authentication:
Authentication: Uses public/private key pairs to authenticate minions.
Encryption: Communicates via ZeroMQ encrypted with AES.
Access Control: Defines granular controls using Access Control Lists (ACLs) in the Salt Master configuration.
Additional Information
For organizations seeking enhanced usability, SaltStack Config offers a graphical interface to streamline workflow management. Additionally, SALT's integration with VMware Tanzu provides advanced automation for enterprise systems.
Installation Example
On a master node (e.g., RedHat):
sudo yum install salt-masterOn minion nodes:
sudo yum install salt-minionConfigure
/etc/salt/minionwith:master: your-master-hostnameThen start the minion:
sudo systemctl enable --now salt-minionAccept the minion on the master:
sudo salt-key -L         # list all keys
sudo salt-key -A         # accept all pending minion keys
Where to Go Next
Git-based states with gitfs
Masterless setups for container deployments
Custom modules in Python
Event-driven orchestration with beacons + reactors
Large 600+ Server Patching in 3 Regions with 3 different Environments Example
Let give an example of have 3 different environments DEV (Development), PREP (Preproduction), and PROD (Production), now let's dig a little deeper and say we have 3 different regions EUS (East US), WUS (West US), and EUR (European) and we would like these patches to be applied on changing dates, such as DEV will be patched on 3 days after the second Tuesday, PREP will be patched on 5 days after the second Tuesday, and PROD will be 5 days after the 3rd Tuesday. The final clause to this mass configuration is, we would like the patches to be applied on the Client Local Time.
In many configurations such as AUM, or JetPatch, you would need several different Maintenace Schedules or plans to create this setup. With SALT, the configuration lies inside the minion, so configuration is much more defined, and simple to manage.
Use Case Recap
You want to patch three environment groups based on local time and specific schedules:
Environment
Schedule Rule
Timezone
Dev
3rd day after 2nd Tuesday of the month
Local
PREP
5th day after 2nd Tuesday of the month
Local
Prod
5th day after 3rd Tuesday of the month
Local
Each server knows its environment via Salt grains, and the local timezone via OS or
timedatectl.Step-by-Step Plan
Set Custom Grains for Environment & Region
Create a Python script (run daily) that:
Checks if today matches the schedule per group
If yes, uses Salt to target minions with the correct grain and run patching
Schedule this script via cron or Salt scheduler
Use Salt States to define patching
Step 1: Define Custom Grains
On each minion, configure
/etc/salt/minion.d/env_grains.conf:grains: environment: dev # or prep, prod region: us-east # or us-west, eu-central, etc.Then restart the minion:
sudo systemctl restart salt-minionVerify:
salt '*' grains.itemsStep 2: Salt State for Patching
Create
patching/init.sls:update-packages: pkg.uptodate: - refresh: True - retry: attempts: 3 interval: 15 reboot-if-needed: module.run: - name: system.reboot - onlyif: 'test -f /var/run/reboot-required'Step 3: Python Script to Orchestrate Patching
Let’s build
run_patching.py. It:Figures out the correct date for patching
Uses
saltCLI to run patching for each groupHandles each group in its region and timezone
#!/usr/bin/env python3 import subprocess import datetime import pytz from dateutil.relativedelta import relativedelta, TU # Define your environments and their rules envs = { "dev": {"offset": 3, "week": 2}, "prep": {"offset": 5, "week": 2}, "prod": {"offset": 5, "week": 3} } # Map environments to regions (optional) regions = { "dev": ["us-east", "us-west"], "prep": ["us-east", "eu-central"], "prod": ["us-east", "us-west", "eu-central"] } # Timezones per region region_tz = { "us-east": "America/New_York", "us-west": "America/Los_Angeles", "eu-central": "Europe/Berlin" } def calculate_patch_date(year, month, week, offset): second_tuesday = datetime.date(year, month, 1) + relativedelta(weekday=TU(week)) return second_tuesday + datetime.timedelta(days=offset) def is_today_patch_day(env, region): now = datetime.datetime.now(pytz.timezone(region_tz[region])) target_day = calculate_patch_date(now.year, now.month, envs[env]["week"], envs[env]["offset"]) return now.date() == target_day and now.hour >= desired_hour def run_salt_target(environment, region): target = f"environment:{environment} and region:{region}" print(f"Patching {target}...") subprocess.run([ "salt", "-C", target, "state.apply", "patching" ]) def main(): for env in envs: for region in regions[env]: if is_today_patch_day(env, region): run_salt_target(env, region) if __name__ == "__main__": main()Make it executable:
chmod +x /srv/scripts/run_patching.pyTest it:
./run_patching.pyStep 4: Schedule via Cron (on Master)
Edit crontab:
crontab -eAdd daily job:
# Run daily at 6 AM UTC 0 6 * * * /srv/scripts/run_patching.py >> /var/log/salt/patching.log 2>&1This assumes the local time logic is handled in the script using each region’s timezone.
Security & Safety Tips
Test patching states on a few dev nodes first (
salt -G 'environment:dev' -l debug state.apply patching)Add Slack/email notifications (Salt Reactor or Python
smtplib)Consider dry-run support with
test=True(inpkg.uptodate)Use
salt-run jobs.list_jobsto track job execution
Optional Enhancements
Use Salt Beacons + Reactors to monitor and patch in real-time
Integrate with JetPatch or Ansible for hybrid control
Add patch deferral logic for critical services
Write to a central patching log DB with job status per host
Overall Architecture
Minions:
Monitor the date/time via beacons
On patch day (based on local logic), send a custom event to the master
Master:
Reacts to that event via a reactor
Targets the sending minion and applies the
patchingstate
Step-by-Step: Salt Beacon + Reactor Model
1. Define a Beacon on Each Minion
File:
/etc/salt/minion.d/patchday_beacon.confbeacons: patchday: interval: 3600 # check every hourThis refers to a custom beacon we will define.
2. Create the Custom Beacon (on all minions)
File:
/srv/salt/_beacons/patchday.pyimport datetime from dateutil.relativedelta import relativedelta, TU import pytz __virtualname__ = 'patchday' def beacon(config): ret = [] grains = __grains__ env = grains.get('environment', 'unknown') region = grains.get('region', 'unknown') # Define rules rules = { "dev": {"offset": 3, "week": 2}, "prep": {"offset": 5, "week": 2}, "prod": {"offset": 5, "week": 3} } region_tz = { "us-east": "America/New_York", "us-west": "America/Los_Angeles", "eu-central": "Europe/Berlin" } if env not in rules or region not in region_tz: return ret # invalid or missing config tz = pytz.timezone(region_tz[region]) now = datetime.datetime.now(tz) rule = rules[env] patch_day = (datetime.date(now.year, now.month, 1) + relativedelta(weekday=TU(rule["week"])) + datetime.timedelta(days=rule["offset"])) if now.date() == patch_day: ret.append({ "tag": "patch/ready", "env": env, "region": region, "datetime": now.isoformat() }) return ret3. Sync Custom Beacon to Minions
On the master:
salt '*' saltutil.sync_beaconsEnable it:
salt '*' beacons.add patchday '{"interval": 3600}'4. Define Reactor on the Master
File:
/etc/salt/master.d/reactor.confreactor: - 'patch/ready': - /srv/reactor/start_patch.sls5. Create Reactor SLS File
File:
/srv/reactor/start_patch.sls{% set minion_id = data['id'] %} run_patching: local.state.apply: - tgt: {{ minion_id }} - arg: - patchingThis reacts to
patch/readyevent and applies thepatchingstate to the calling minion.6. Testing the Full Flow
Restart the minion:
systemctl restart salt-minionConfirm the beacon is registered:
salt '*' beacons.listTrigger a manual test (simulate patch day by modifying date logic)
Watch events on master:
salt-run state.event pretty=TrueConfirm patching applied:
salt '*' saltutil.running7. Example:
patching/init.slsAlready shared, but here it is again for completeness:
update-packages: pkg.uptodate: - refresh: True - retry: attempts: 3 interval: 15 reboot-if-needed: module.run: - name: system.reboot - onlyif: 'test -f /var/run/reboot-required'Benefits of This Model
Real-time and event-driven – no need for polling or external scripts
Timezone-aware, thanks to local beacon logic
Self-healing – minions signal readiness independently
Audit trail – each event is logged in Salt’s event bus
Extensible – you can easily add Slack/email alerts via additional reactors
Goal
Track patching event completions per minion
Store patch event metadata: who patched, when, result, OS, IP, environment, region, etc.
Generate readable reports in:
CSV/Excel
HTML dashboard
JSON for API or SIEM ingestion
Step 1: Customize Reactor to Log Completion
Let’s log each successful patch into a central log file or database (like SQLite or MariaDB).
Update Reactor:
/srv/reactor/start_patch.slsAdd a returner to store job status.
{% set minion_id = data['id'] %} run_patching: local.state.apply: - tgt: {{ minion_id }} - arg: - patching - kwarg: returner: local_json # You can also use 'mysql', 'elasticsearch', etc.Configure Returner (e.g.,
local_json)In
/etc/salt/master:returner_dirs: - /srv/salt/returners ext_returners: local_json: file: /var/log/salt/patch_report.jsonOr use a MySQL returner:
mysql.host: 'localhost'
mysql.user: 'salt'
mysql.pass: 'yourpassword'
mysql.db: 'salt'
mysql.port: 3306
Enable returners:
salt-run saltutil.sync_returnersStep 2: Normalize Patch Data (Optional Post-Processor)
If using JSON log, create a post-processing script to build reports:
process_patch_log.pyimport json import csv from datetime import datetime def load_events(log_file): with open(log_file, 'r') as f: return [json.loads(line) for line in f if line.strip()] def export_csv(events, out_file): with open(out_file, 'w', newline='') as f: writer = csv.DictWriter(f, fieldnames=[ 'minion', 'date', 'environment', 'region', 'result' ]) writer.writeheader() for e in events: writer.writerow({ 'minion': e['id'], 'date': datetime.fromtimestamp(e['_stamp']).isoformat(), 'environment': e['return'].get('grains', {}).get('environment', 'unknown'), 'region': e['return'].get('grains', {}).get('region', 'unknown'), 'result': 'success' if e['success'] else 'failure' }) events = load_events('/var/log/salt/patch_report.json') export_csv(events, '/srv/reports/patching_report.csv')Step 3: Build a Simple Web Dashboard
If you want to display reports via a browser:
🛠 Tools:
Flask or FastAPI
Bootstrap or Chart.js
Reads JSON/CSV and renders:
Example Chart Dashboard Features:
✅ Last patch date per server
📍 Patching success rate per region/env
🔴 Highlight failed patching
📆 Monthly compliance timeline
Would you like a working example of that Flask dashboard? I can include the full codebase if so.
Step 4: Send Reports via Email (Optional)
🐍 Python:
send_report_email.pyimport smtplib from email.message import EmailMessage msg = EmailMessage() msg["Subject"] = "Monthly Patch Report" msg["From"] = "patchbot@example.com" msg["To"] = "it-lead@example.com" msg.set_content("Attached is the patch compliance report.") with open("/srv/reports/patching_report.csv", "rb") as f: msg.add_attachment(f.read(), maintype="text", subtype="csv", filename="patching_report.csv") with smtplib.SMTP("localhost") as s: s.send_message(msg)Schedule that weekly or monthly with
cron.Flask Dashboard (Patch Reporting)
app.py
from flask import Flask, render_template
import csv
from collections import defaultdict

app = Flask(__name__)

@app.route('/')
def index():
    results = []
    success_count = defaultdict(int)
    fail_count = defaultdict(int)

    with open('/srv/reports/patching_report.csv', 'r') as f:
        reader = csv.DictReader(f)
        for row in reader:
            results.append(row)
            key = f"{row['environment']} - {row['region']}"
            if row['result'] == 'success':
                success_count[key] += 1
            else:
                fail_count[key] += 1

    summary = [
        {"group": k, "success": success_count[k], "fail": fail_count[k]}
        for k in sorted(set(success_count) | set(fail_count))
    ]

    return render_template('dashboard.html', results=results, summary=summary)

if __name__ == '__main__':
    app.run(debug=True, host='0.0.0.0', port=5000)
templates/dashboard.html
<!DOCTYPE html>
<html>
<head>
  <title>Patch Compliance Dashboard</title>
  <style>
    body { font-family: Arial; padding: 20px; }
    table { border-collapse: collapse; width: 100%; margin-bottom: 30px; }
    th, td { border: 1px solid #ccc; padding: 8px; text-align: left; }
    th { background-color: #f4f4f4; }
    .fail { background-color: #fdd; }
    .success { background-color: #dfd; }
  </style>
</head>
<body>
  <h1>Patch Compliance Dashboard</h1>

  <h2>Summary</h2>
  <table>
    <tr><th>Group</th><th>Success</th><th>Failure</th></tr>
    {% for row in summary %}
    <tr>
      <td>{{ row.group }}</td>
      <td>{{ row.success }}</td>
      <td>{{ row.fail }}</td>
    </tr>
    {% endfor %}
  </table>

  <h2>Detailed Results</h2>
  <table>
    <tr><th>Minion</th><th>Date</th><th>Environment</th><th>Region</th><th>Result</th></tr>
    {% for row in results %}
    <tr class="{{ row.result }}">
      <td>{{ row.minion }}</td>
      <td>{{ row.date }}</td>
      <td>{{ row.environment }}</td>
      <td>{{ row.region }}</td>
      <td>{{ row.result }}</td>
    </tr>
    {% endfor %}
  </table>
</body>
</html>
How to Use
pip install flask
python app.py
Then visit
http://localhost:5000or your server’s IP at port 5000.Optional: SIEM/Event Forwarding
If you use Elasticsearch, Splunk, or Mezmo:
Use a returner like
es_return,splunk_return, or send via custom script using REST API.Normalize fields: hostname, env, os, patch time, result
Filter dashboards by compliance groupings
TL;DR: Reporting Components Checklist
Component
Purpose
Tool
JSON/DB logging
Track patch status
Returners
Post-processing script
Normalize data for business
Python
CSV/Excel export
Shareable report format
Python
csvmoduleHTML dashboard
Visualize trends/compliance
Flask, Chart.js, Bootstrap
Email automation
Notify stakeholders
smtplib, cronSIEM/Splunk integration
Enterprise log ingestion
REST API or native returners
Recent Entries
-
by: Abhishek Prakash
Fri, 27 Jun 2025 18:29:17 +0530We have converted our text-based Docker course into an eBook; Learn Docker Quickly.
It is available for free to LHB Pro members along with all the other eBooks in the resources section.
If you are not a Pro member, you can either opt for the Pro membership or purchase just this ebook from our Gumroad page.
I am working on the next series and hopefully, you'll see it in July. Stay tuned 😄
Recent Entries
-
No blog entries yet